
New unisex mortality table: impact on your savings and social commitments

Rédigé par Amadou Kasse Publié le 20/12/2024
Partager
Order ECOT2426307 of November 18, 2024 marks a major new regulatory development in the field of retirement savings, with the introduction of a single mortality table applicable by insurers. This measure, in force since November 23, 2024, puts an end to the use of tables differentiated between men and women for the calculation of life annuities in supplementary pension contracts (defined-contribution pension (Article 83 of the CGI, PER or defined-benefit pension - Article 39 of the CGI).
What is a mortality table?
A mortality table is a statistical tool that estimates average life expectancy by age. Insurers use these tables to calculate the amount of annuities to be paid out on retirement. They determine the presumed duration over which an annuity will be paid, thus directly influencing its annual amount.
What changes has the Green Industry Act introduced?
Until now, insurers have applied gendered mortality tables, reflecting a higher life expectancy for women than for men. This difference resulted in lower annual annuities for women with equal savings, up to 10-14% lower than for men.
With the entry into force of the Green Industry Act on October 24, 2024, a single mortality table is imposed for all new contracts and contracts with tacit renewal. This single table is calculated on a weighted average of the approved tables (male and female), with a weighting of 40% for the table established for the female sex and 60% for the table established for the male sex.
What impact will the new mortality table have on savers (employees) and employers?
For employees :
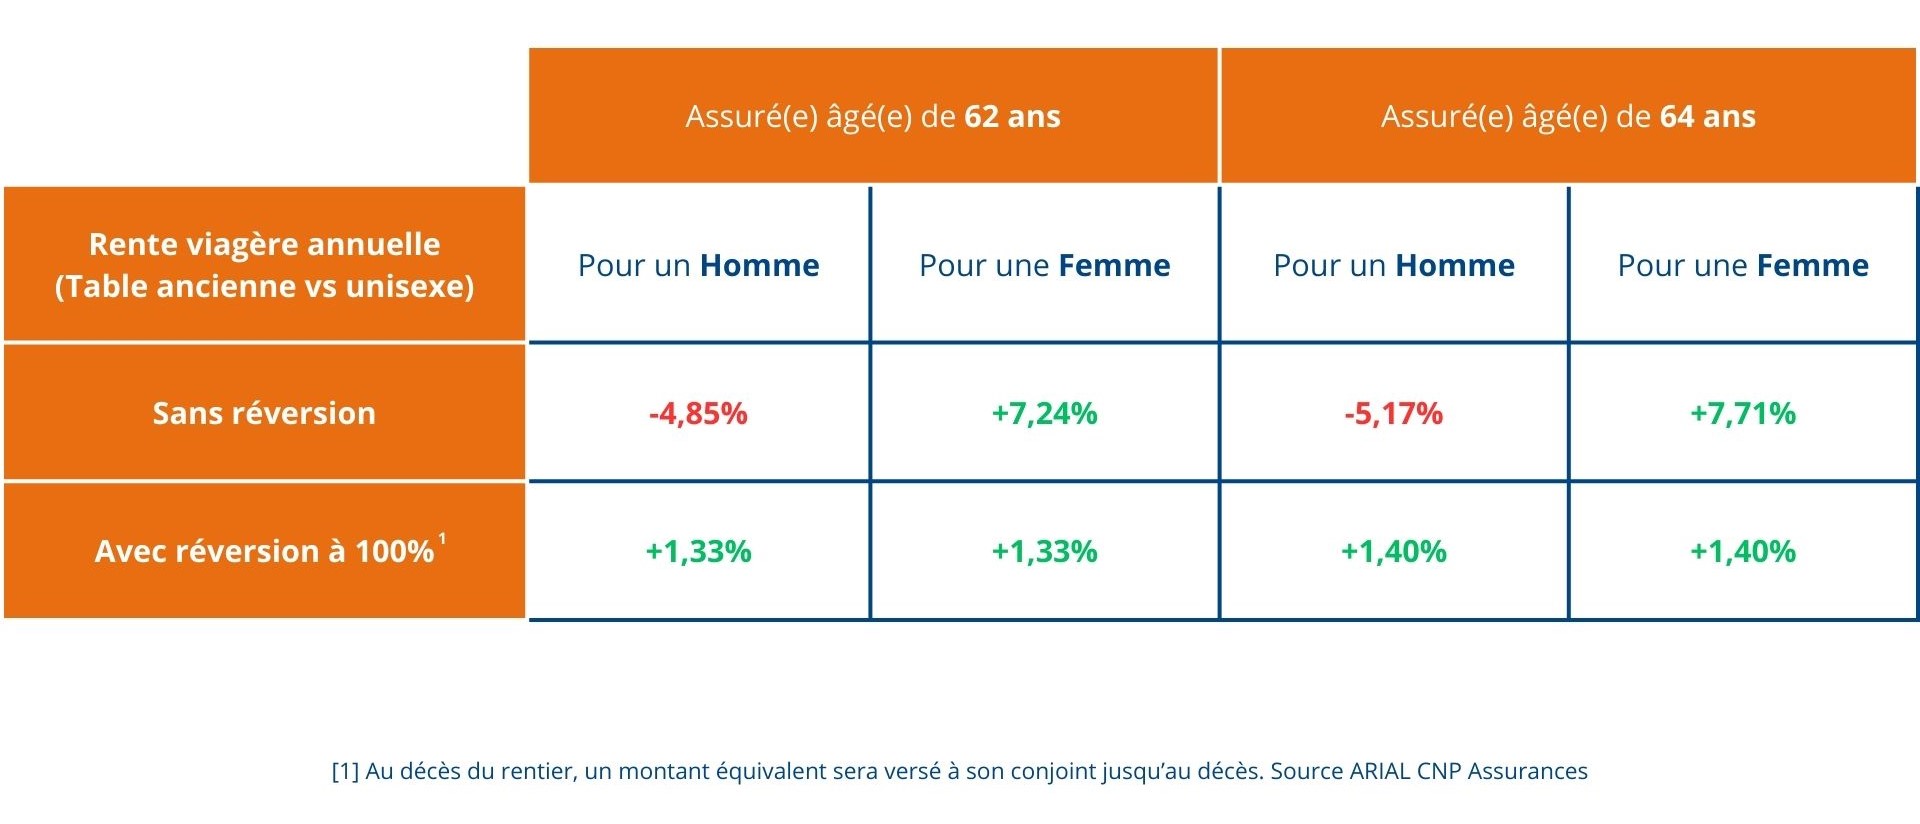
- Men: as a higher life expectancy is assumed, the calculated annual pension will be slightly lower.
- Women: as a lower life expectancy is taken into account, the annual pension will be increased.
- Joint and survivor annuities: in the case of annuities providing for reversion to a different-sex spouse, the overall amount will be slightly revalued.
Table showing the estimated impact on life income of the unisex table compared with the "gendered" tables for men and women:
Sources: Gerep
Increase in the liquidation ceiling for capital savings plans
Speaking of fair treatment, the new unisex mortality table equalizes the capital savings liquidation ceiling for men and women. The result is an increase for men and a decrease for women. Nevertheless, the age of liquidation remains a key factor influencing the amount of capital that can be redeemed in a single lump sum on retirement.
Table showing the increase in the capital savings liquidation ceiling :
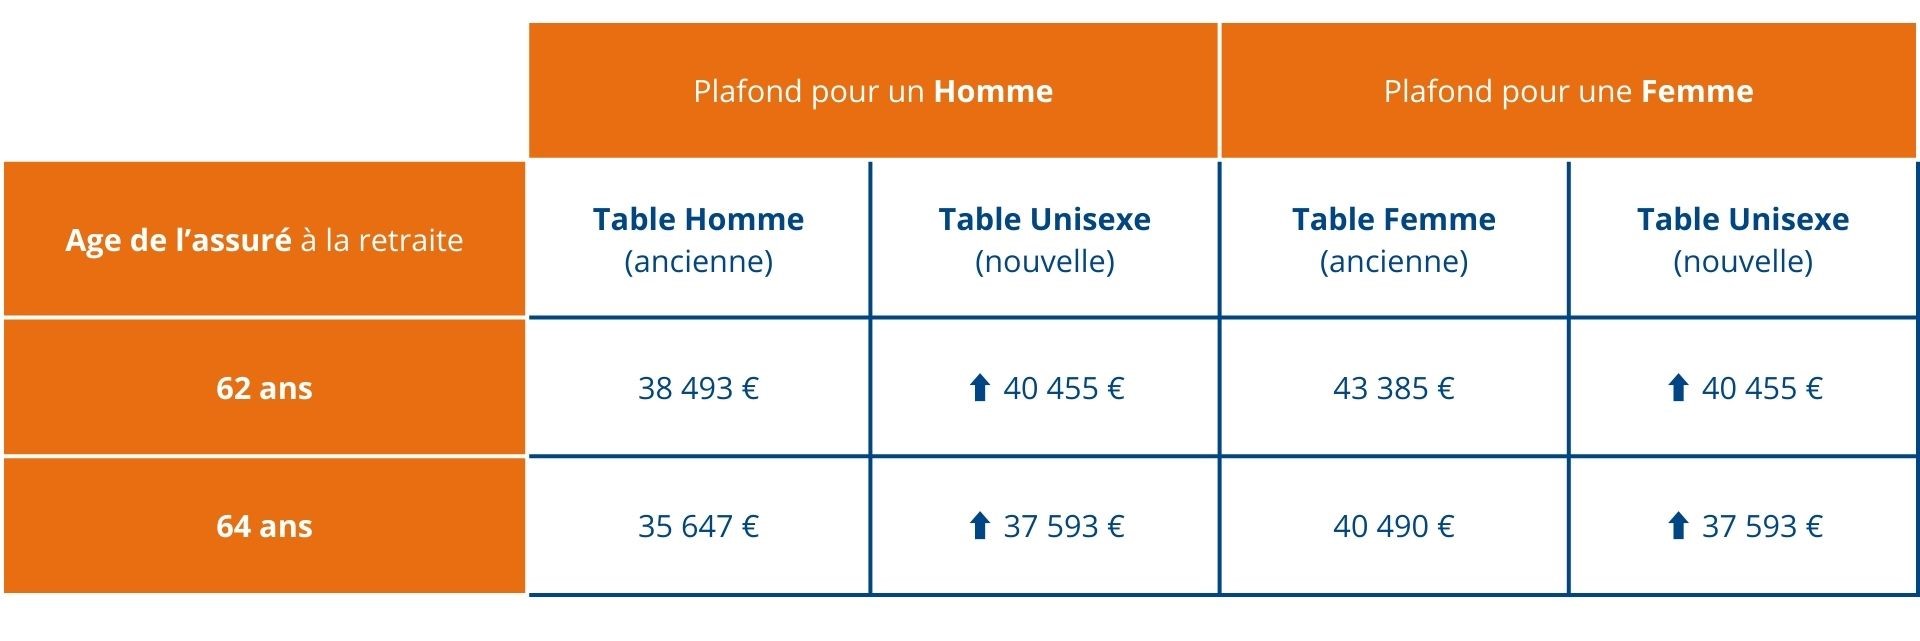
Note: the amounts presented below are given for information only and may vary according to the specific parameters of your contract.
Sources: Gerep
For companies :
This regulatory change could have an impact on the social commitments of employers with defined-benefit plans. The potential increase in annuities for certain profiles and the need to adjust technical provisions could result in additional costs for companies.
How can we anticipate these changes?
HR directors, CFOs and compensation managers need to assess the impact of this reform on existingretirement savings schemes. A review of group contracts, together with clear communication to the employees concerned, will be essential to ensure a smooth transition. This reform is part of an egalitarian neutrality approach, and could ultimately influence pension scheme financing strategies. Decision-makers therefore need to be sure of expert support in mastering these changes and their financial impact.
FAQ : Answers to frequently asked questions about the mortality table
A mortality table has many applications in various fields.
- Calculation of life annuities: In pension insurance, it is used to forecast the average payment period of life annuities and to set the annual amount.
- Risk assessment: In life insurance and pension plans, it helps to evaluate the financial risks associated with the longevity of policyholders.
- Demographic forecasting: public bodies use these data to analyze population trends and adapt social and public health policies.
- Calculation of employee benefit obligations: Companies use mortality tables to assess their financial obligations under defined-benefit pension plans and other employee benefit obligations.
Mortality tables are indispensable tools for risk management : provident savings, retirement savings, etc. They have a direct influence on strategic and financial decisions . They have a direct impact on strategic and financial decisions.
Creating a mortality table is a methodical process based on reliable demographic data.
Collecting data from censuses, death certificates or specific statistical databases.
This information is used to assess the probability of death at each age, and mortality rates are calculated by dividing the number of deaths by the population exposed to the risk.
Once these mortality rates have been calculated, the number of survivors is established by applying these probabilities to a theoretical initial population (often 100,000 individuals at birth). This models the number of people still alive at each age.
Finally, residual life expectancy is calculated by estimating the average remaining life for a person of a given age, based on data on survivors.
This process, though complex, is often aided by specialized software. These tools guarantee optimum accuracy, and are essential for insurers, demographers and decision-makers who use these tables to anticipate longevity-related needs and risks.
A mortality table is a statistical table that groups together information on the probability of death in a given population according to age. To read it correctly, you need to focus on several key elements.
- Age Each line corresponds to a specific age, usually expressed in years.
- Probability of death (qx) This column indicates the probability that a person aged x will die before reaching x+1.
- Surviving population (lx) This figure represents the theoretical number of people still alive at a given age, out of an initial population of 100,000 (or some other defined total).
- Residual life expectancy (ex) This data estimates the average remaining life expectancy for a person who has reached age x.
Example If the table indicates that at age 65, the probability of death (q65) is 0.015, this means that there is a 1.5% chance that a 65-year-old will die before the age of 66.
Article écrit par
Amadou Kasse
Des articles qui pourraient vous intéresser

Reassurance with an additional “Article 83” retirement pension
 Margaux Vieillard-Baron

 Julien Jourdin

Defined-benefit supplementary pensions schemes under threat from Brussels
Margaux Vieillard-Baron


Mental health: a national priority and a strategic challenge for HR
Margaux Vieillard-Baron

 Clément Zhang